The Dashboard - Manager / Partner

Daniel Sigrist
Last Update 5 years ago
The Manager dashboard show a summary of the projects on the period of time selected by you:
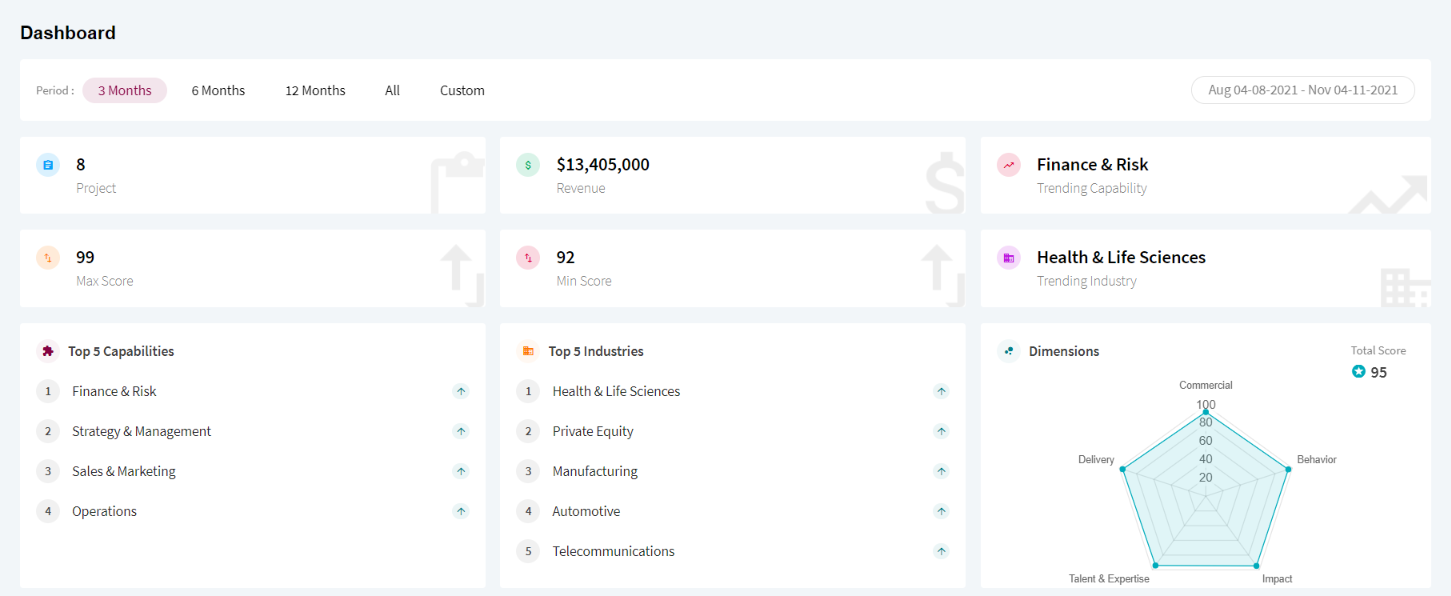
You can choose to see the projects from the last 3, 6 or 12 months. You also can see all of them or a custom period of time.
On the top of the screen, you have information about:
- The number of the projects
- How much revenue they generated
- The highest score the projects received
- The lowest score the projects received
- The trending capability
- The trending Industry
- The top 5 Capabilities
- The top 5 Industries
- The score's spider chart, making easy to visualize the five essential dimensions.
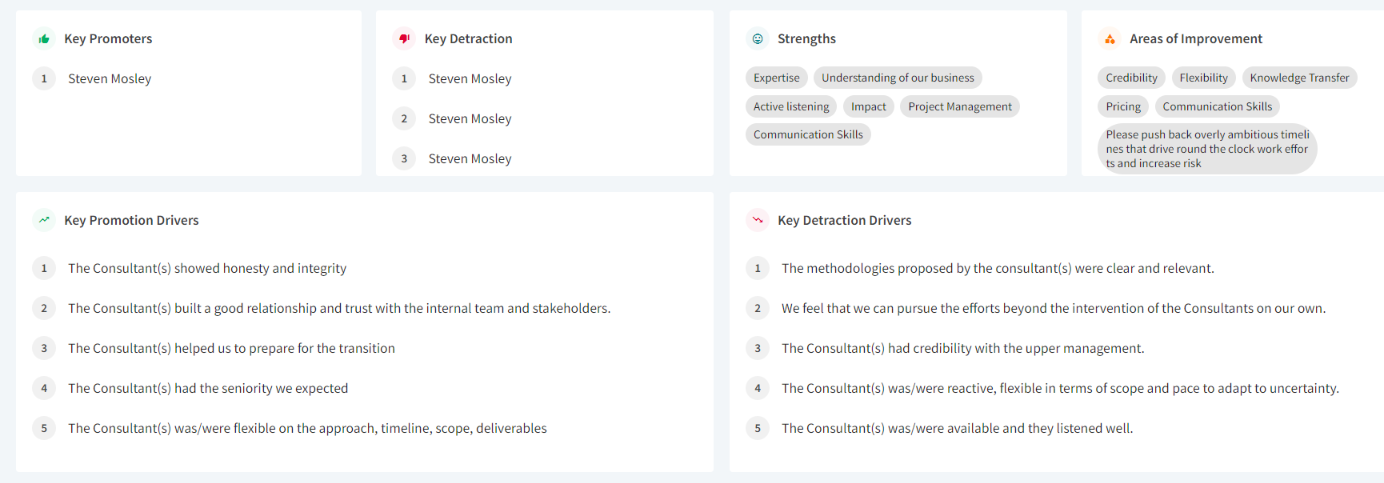
On the bottom of the screen, you can see:
- The key promoters
- The key detractors
- The strengths
- The areas of improvement
- The key promotion drivers
- The key detraction drivers
If your user has the manager role, you can see more than your own projects.
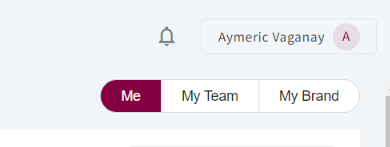
Using the filter on the top right corner of the screen, you can choose to see your projects, the projects from your team, or the ones from your brand.