The Dashboard - Administrator

Daniel Sigrist
Last Update för 5 år sedan
The Dashboard for consulting firms is composed of 4 sectors:
Company Summary:
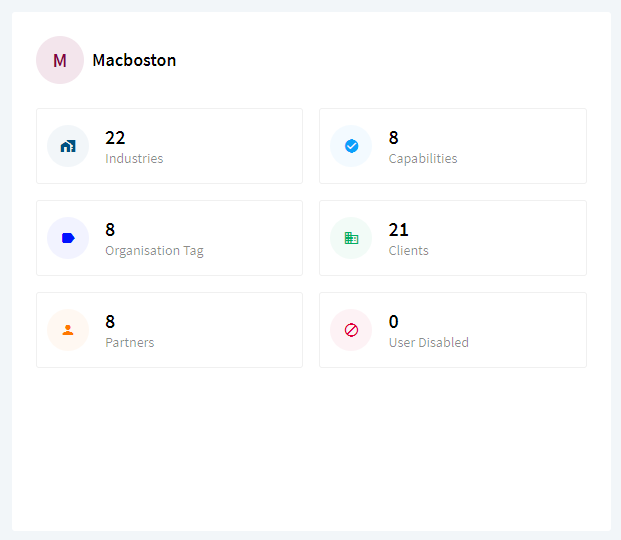
Here you can see the summary of your company. You can see how many industries do you serve, how many capabilities you have, how many organizations tags, how many clients, how many partners and how many users you disabled.
Activity Summary:
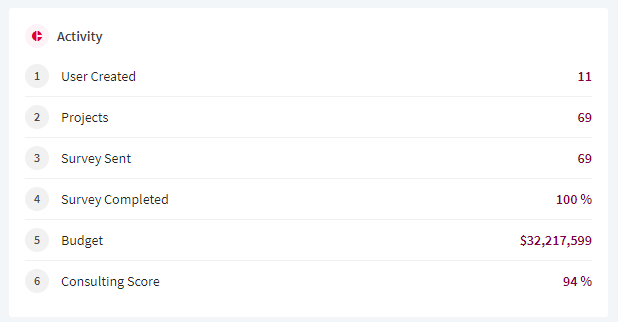
Here you can see:
1) How many users you created.
2) How many projects you have.
3) How many surveys you sent.
4) The percentage of surveys completed.
5) Your current budget.
6) Your current consulting score.
Performance Summary:
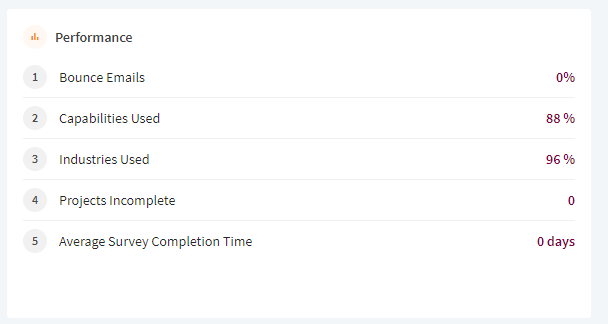
Here we have:
1) It is when the emails you send are bouncing back. They are not delivered. It means the emails are wrong, or your domain has a bad reputation.
2) It is the proportion of capabilities declared and used.
3) It is the proportion of industries declared and used.
4) It is the number of ongoing projects.
5) It is the average number of days that take the clients to answer the survey.
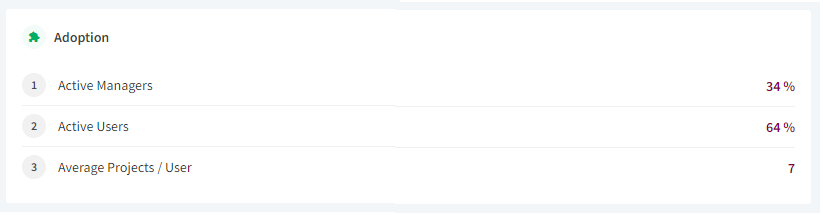
Adoption Summary:
Here we have:
1) It is the proportion of managers registered and active.
2) It is the proportion of users registered and active.
3) An average number of projects per user.